Subject: ACC0004dg0
Comments
-
 by
Rebex
by
Rebex
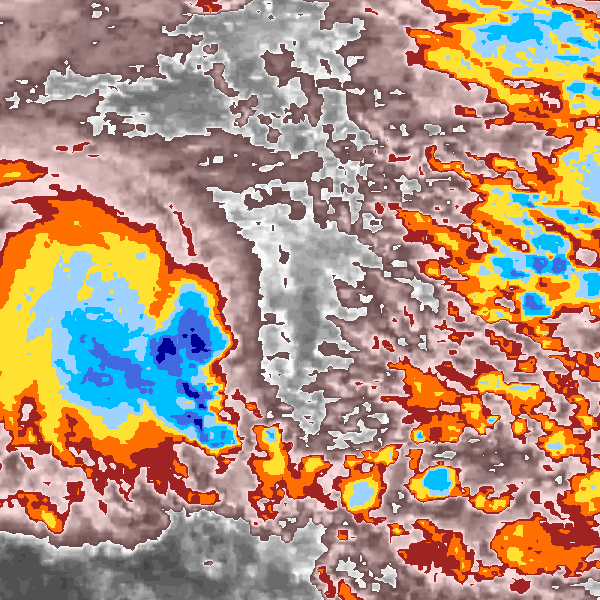
I found this one really difficult. Also, I don't understand what I'm seeing on the graph afterwards - is that explained anywhere?
Posted
-
by
peterthorne
moderator
Rebex, I would classify this one as strong shear with the center some distance to the East of the cold clouds.
Posted
-
by
peterthorne
moderator
The graph beneath and map shows the best tracks data - wind speed and pressure and track. This data is inhomogeneous and you are helping
Posted
-
by
peterthorne
moderator
us to clean up and better understand the data in a globally consistent manner. Let us know if this helps at all?
Posted
-
by
Rebex
I'm sorry - I was miles out on that one
Posted
-
by
peterthorne
moderator
Nobody is ever miles out. I could be way wrong 😃. Classify as you see it. We get each image several times by distinct people.
Posted